
Introduction
Many air quality models parameterize net weights or volumes of pollutants dispersed into the environment. Here it is the volume of air passing through various engines which is estimated and packaged in familiar terms for the public.
First a reference volume of air is defined as the volume one average human needs for breathing during 24 hours. This volume of approximately 9,700 litres/human called here one human-day (hum-day) is derived using an inhaled volume of 0.5 litre per breath × 13.5 breaths/minute × 60 minutes/hour × 24 hours/day (Lough, 1983). Forty human-days of air is the volume forty (40) people need for breathing for one day.
Similarly, one population-day (pop-day) of air is the volume obtained by multiplying one hum-day by the number of people in a population. In this study, the population of the island of Montreal in 2001 is used making one pop-day equal to 1,812,723 people × 9,700 L/person = 1.76×10¹⁰ litres. One hundred (100) pop-days of air is one hundred times the volume of air required for breathing during one day by Montreal's population.
These reference volumes of air will be used later to help present air volume information in terms the public can more easily relate to and as a result may assist in better engaging the public in air pollution prevention activities.
Estimating combustion engine air consumption volumes
Volumes of air passing through combustion engines are estimated using the engine cylinder's displacement in litres (L) × engine rpm × number of minutes of operation.
A 2-stroke engine with displacement of fifty (50) cc (0.050 L) operating for thirty (30) minutes at five thousand (5,000) rpm is estimated to consume 0.05 L × 5,000 rpm × 30 minutes = 67,500 litres.
4-stroke combustion engine calculations require the rpm be divided by two since air is exhausted from the cylinders every second revolution (Canadian Automobile Association, 1983). A 4-stroke engine with one litre displacement operating for 60 minutes at 2,500 rpm is estimated to consume 1 L × 2,500/2 rpm × 60 minutes = 75,000 litres of air.
These volumes of air “consumed” by engines also serve as estimates of initial volumes of undiluted engine exhaust.
Cylinder volumes, or displacements, of various combustion engines are listed in column 1 of table 1 for a variety of engines. 2-stroke engine sizes were obtained by noting those available in local hardware stores. 4-stroke displacements were obtained from the many vehicle related advertisements and articles in Montreal's The Gazette newspaper (The Gazette, 2004, 2005).
Table 1
| Type | Engine | (1) Cylinder displacement (L) |
(2) RPM |
(3) Operating time (minutes) |
(4) Air volume consumed (L) |
(5) Human- days of air per hour |
|---|---|---|---|---|---|---|
| 2-stroke | Lawn mower | 0.05 | 5,000 | 30 | 7,700 | 1.5 |
| Hedger | 0.02 | 5,000 | 30 | 3,000 | 0.6 | |
| Chainsaw | 0.04 | 5,000 | 30 | 6,000 | 1.2 | |
| Jet ski | 1.1 | 4,000 | 30 | 130,000 | 27 | |
| 4-stroke Local | Smart car | 0.8 | 3,000 | 60 | 72,000 | 7 |
| Compact car | 3.1 | 3,000 | 60 | 280,000 | 29 | |
| SUV | 4.3 | 3,000 | 60 | 390,000 | 40 | |
| School bus | 6.6 | 3,000 | 60 | 600,000 | 61 | |
| Truck | 12 | 3,000 | 60 | 1,100,000 | 111 | |
| Truck construction | 12 | 3,000 | 60 | 1,100,000 | 111 | |
| 4-stroke Highway | Compact car | 3.1 | 2,500 | 60 | 230,000 | 24 |
| SUV | 4.3 | 2,500 | 60 | 320,000 | 33 | |
| Truck | 12 | 2,500 | 60 | 900,000 | 93 |
Table 2
| Step | Process | Throttle (%) | Speed (km/h) | Core airflow (kg/s) | Rate (L/s) | Minutes | Air volume consumed (L) | Human- days for 2 engines |
|---|---|---|---|---|---|---|---|---|
| Take-off | Terminal | 40 | 0 | 10.65 | 8,341 | 30 | 1.5×10⁷ | 3,096 |
| Taxiing | 55 | 10 | 22.53 | 17,646 | 5 | 5.3×10⁶ | 1,091 | |
| Runway | 60 | 285 | 34.2 | 26,786 | 1 | 1.6×10⁶ | 331 | |
| Landing | Runway | 40 | 0 | 34 | 26,629 | 2 | 3.2×10⁶ | 659 |
| Taxiing | 55 | 10 | 22.53 | 17,646 | 5 | 5.3×10⁶ | 1,091 | |
| Terminal | 40 | 217 | 10.65 | 8,341 | 15 | 7.5×10⁶ | 1,548 | |
| Total | 3.8×10⁷ | |||||||
Table 3
| Type | (1) Engine |
(2) Air consump- tion (L) |
(3) Units |
(4) Number of Human- days |
(5) Total number in city |
(6) Total daily consump- tion (L) / category |
(7) Number pop- days per day |
|---|---|---|---|---|---|---|---|
| People | Person | 9.7×10³ | L / day | 1 | 1,812,723 | 1.76×10¹⁰ | 1 |
| 2- stroke | Mower | 7.5×10³ | L / 0.5 hour | 0.77 | 443,947 | 3.3×10⁹ | 0.2 |
| Hedger | 3×10³ | L / 0.5 hour | 0.31 | 443,947 | 1.3×10⁹ | 0.1 | |
| Chainsaw | 6×10³ | L / 0.5 hour | 0.62 | 88,789 | 5.3×10⁸ | 0.03 | |
| Jet ski | 1.3×10⁵ | L / 0.5 hour | 13.6 | 1,421 | 1.9×10⁸ | 0.01 | |
| 4- stroke Local | Efficient | 7.2×10⁴ | L / hour | 7 | 1,776 | 1.3×10⁸ | 0.01 |
| Compact | 2.8×10⁵ | L / hour | 29 | 1,065,473 | 3×10¹¹ | 17 | |
| SUV | 3.9×10⁵ | L / hour | 40 | 710,315 | 2.8×10¹¹ | 16 | |
| School bus | 6×10⁵ | L / hour | 61 | 500 | 1.8×10⁹ | 0.1 | |
| Truck | 1.1×10⁶ | L / hour | 111 | 266,368 | 2.3×10¹² | 131 | |
| Truck construction | 1.1×10⁶ | L / hour | 111 | 10,000 | 8.6×10¹⁰ | 5 | |
| 4- stroke Highway | Compact | 2.3×10⁵ | L / 0.75 hour | 24 | 100,000 | 1.7×10¹⁰ | 1 |
| SUV | 3.2×10⁵ | L / 0.75 hour | 33 | 90,000 | 2.2×10¹⁰ | 1.2 | |
| Truck | 9×10⁵ | L / 0.75 hour | 93 | 70,000 | 4.7×10¹⁰ | 2.7 | |
| Airplane A320 | Take-off | 4.4×10⁷ | L | 4,600 | 250 | 1.1×10¹⁰ | 0.63 |
| Landing | 3.2×10⁷ | L | 3,400 | 250 | 8×10⁹ | 0.45 | |
| Total | 3.1×10¹² | 175 | |||||
4-stroke engines were considered either local or highway vehicles and assigned rpm values of 3,000 and 2,500 respectively. Local vehicles remained in the city while highway vehicles travelled through the city on a main highway.
The goal to calculate a volume of air passing through engines to become undiluted exhaust, assumes consumed air is not re-used by any other engine. It is also assumed that consumed air becomes tainted with combustion fumes and would be unfit for humans to breathe. For this calculation, however, exhaust volumes are not diluted further with ambient air.
Airflow through an airplane engine is also estimated.
The Airbus A320 airplane was considered representative of the majority of planes flying in and out of Pierre-Elliot-Trudeau International Airport in Montreal where there are about 250 daily take-offs and landings (Isaac, 2005).
Operating characteristics of the Airbus A320 CFM56-5A1 turbo fan engines were provided by www.flybernhard.de and from personal communication with an airline pilot. Estimates of airflow were obtained from NASA's engine simulator website using configuration information in table 2 and verified with the site's owner (Benson, Thomas, email communication, 2005).
As seen in table 2, large volumes of air are used by the plane's engines during idling of engines while waiting at the terminal and taxiing to and from the runway.
Comparing air consumption volumes for various engines
Table 3 presents the summary of engine air consumptions.
Column (2) lists air consumption volumes for individual engines (except for 2 engines in the case of the Airbus) during the associated operating period in column (3).
Column (4) presents volumes of column (2) as multiples of human-days of air.
Individual airplane engines consume the largest volumes of air requiring, per pair of engines, an estimated 8,000 humandays of air from each combination of take-off and landing.
For combustion engines, a local truck consumes approximately 111 human-days of air per hour of operation. A highway truck using a lower rpm value and shorter transit time consumes approximately 93 human-days of air per truck. Local school buses, SUVs and compact cars used 61, 40 and 29 human-days of air per hour respectively. Jet skis, lawn mowers, chainsaws and hedgers consumed 27, 1.5, 1.2, 0.6 human-days of air per hour respectively.
Estimating total engine air consumption volumes for Montreal
Table 3 data can be used to model total air consumption volumes for an urban area. A preliminary scenario is presented here to demonstrate the concept. There is interest in obtaining higher quality data from various municipal databases to feed into this model.
Column (5) of table 3 presents preliminary estimates of the total number of each engine type for the island of Montreal.
For most engine types, multiplying the number of engines in column (5) by the corresponding air consumption rates in column (2) provides estimates of total volumes of air consumed, per day, by engine category. In the case of local trucks and school buses, those engines were operated for 8 and 6 hours per day respectively. Total air consumption volumes per day are shown in column (6).
The sum of numbers in column (6) represents the total volume of air consumed by all engines during one day, i.e. 3.1×10¹² litres. This total also estimates the volume of undiluted exhaust produced by all engines here for a one-day period.
Trucks, compact cars, SUVs and airplanes are responsible for about 75%, 10%, 9% and 0.7% of the exhaust produced during a one-day period respectively. Truck engines produce the largest volumes of exhaust air.
The number of pop-days of air for each engine category is shown in column (7) and was obtained by dividing values of column (6) by the number of litres in 1 pop-day.
All trucks combined use approximately 139 pop-days of air per day. SUVs and cars combined use about 35 pop-days of air per day. Airplane engines use about 1 pop-day of air per day. All 2-stroke engines use just over 0.3 pop-day of air per day.
Though airplane engines individually consume the most air per engine, trucks and passenger vehicles as a group use far more air than all airplane engines combined.
In total, all engines combined use about 175 pop-days of air per day, i.e. 175 times the volume of air required by Montreal's population for a 1 day period.
Air volume consumption data helps highlight producers of large volumes of exhaust and may assist justifying restrictions on certain activities during smog alert days as a way to more effectively prevent air pollution and protect the public's health.
Air consumption in stagnant air under a summertime ridge
How quickly would a volume of air get converted into exhaust by engines operating under a stagnant high pressure ridge typical of summertime conditions conducive to smog?
First a reference supply of stagnant air is defined as the volume within the boundary layer 1.0 km high over the 500 km2 area of Montreal island giving a volume of 5.0×10¹⁴ litres.
If the city's engines produce 3.1×10¹² litres of undiluted exhaust per day and assuming engines use only clean air at input, it would take about 160 days for all engines to have converted the stagnant boundary layer air into undiluted engine exhaust.
It's important to remember vehicle exhaust should be diluted prior to humans breathing it and for this reason the volume of fresh air used to dilute exhaust should be considered as air impacted or required by engines. Using a first order approximation of diluting each litre of exhaust into 1,000 litres of fresh air suggests engines require 1.31×10¹² litres exhaust + 1.31×10¹⁵ litres of fresh air per day. Thus when dilution is considered and fresh air considered necessary, then engines effectively consume the reference volume of air in 5×10¹⁴ / 3.1×1015 = 0.16 days.
This back-of-the envelope calculation highlights the volumes of exhaust engines produce and how critically important a source of fresh air is to dilute the exhaust down to safer levels for breathing.
The concept demonstrates the importance of a source of fresh air in the process of exhaust management. Guidelines may be required to help communities pro-actively manage their exhaust-producing activities when stagnant weather systems prevent enough fresh air from diluting the exhaust to safe enough levels for humans.
Figure 1
Percentage of total air volume consumed by engine category per day. Trucks consume the most air and as a result produce most of the exhaust per day.
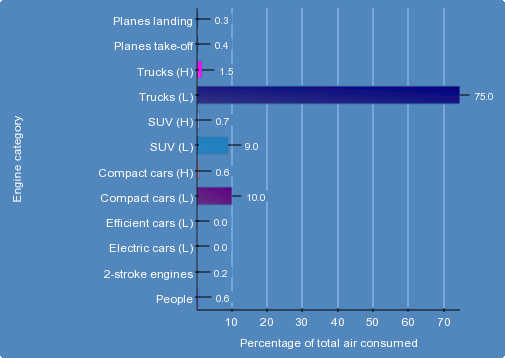
(L): local traffic; (H): highway traffic
Figure 2
Air consumption volume per engine category expressed as number of population-days of air. All trucks combined produce about 139 pop-days' worth of exhaust air.
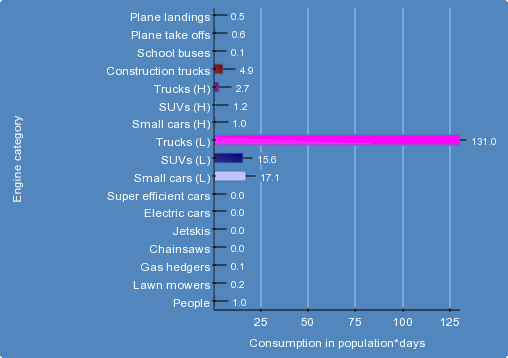
(L): local traffic; (H): highway traffic
Table 4
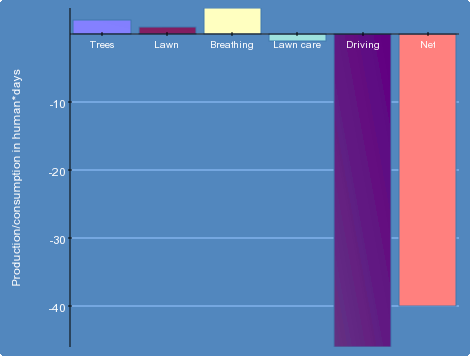
Sample input parameters for air volume consumption “footprint” calculations. Net air consumptions calculated using these parameters are shown in figure 3
| Variable | Value |
|---|---|
| Area of lawn | 50 square meters |
| Number of people at home | 4 |
| Your car's engine displacement | 4 litres |
| Your time of driving per day | 90 minutes |
| Frequency of driving | 6 days/week |
| Displacement 2-stroke mower | 30 cc |
| Displacement 2-stroke hedger | 20 cc |
| Displacement 2-stroke blower | 20 cc |
| Displacement 2-stroke chainsaw | 0 cc |
Figure 3
Sample estimates of air production & consumption volumes as number of human-days per activity per day based on input parameters of table 4. Positive (negative) values indicate volumes of fresh (tainted) air produced.
Information such as volume of readily available fresh air for dilution or the number of days to full local air consumption by engines may offer greater tools and incentives to governments for discouraging behaviours that pollute the local air supply especially in stagnant air scenarios.
Public education tools promoting air consumption awareness
Since education is often a preferred approach by governments to encourage environmentally-sustainable practices, air volume consumption awareness may be an effective tool.
A web page could allow the calculation of one's air volume consumption “footprint”. Users could provide information such as car engine size, driving times, small engines used at home, area of lawn, number of trees, etc. A net balance of air consumed can be calculated and displayed as shown in figure 3.
Air consumption footprint calculations could assist in rationalizing and personalizing the need to practise less polluting behaviour. It is important to realize especially on poor air quality days, that for each hour of not driving one's car, the air that could be used by more than 30 people to breathe during one day will not be converted into engine exhaust.
Air consumption footprint calculations could be undertaken for city or regional areas using their own local vehicle databases. Knowing how many litres of air per day are locally consumed and tainted allows communities to more clearly set pollution reduction objectives and develop a locally owned and operated air quality management plan. This plan could include an exhaust avoidance approach which prevents certain engines creating exhaust on those days when there is not enough fresh air to dilute the exhaust to safe levels for breathing.
Air volume consumption information could also be added to vehicle dashboard tachometers to remind drivers of the number of human-days of air consumed and exhaust produced while driving. A sample tachometer is shown in figure 4.
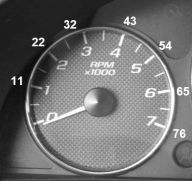
Figure 4
A tachometer displaying the number of humandays of air consumed by a 3.5 L engine as a function of rpm. Driving at 2,000 rpm for one hour uses 22 human-days of air through the engine and converts that air into exhaust.
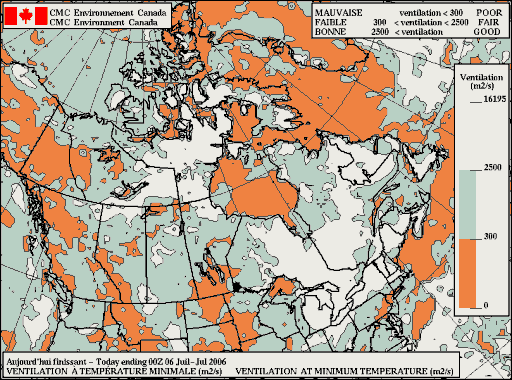
Figure 5
A sample ventilation forecast map indicating the ability of the atmosphere to effectively provide “fresh air” over a given point. Ventilation depends on the mixing layer depth and wind speed within the layer. Areas with poor ventilation (under 2,500 square metres per second) are highlighted on the map. Ventilation maps are available on www.weatheroffice.ec.gc.ca via the Air Quality Forecasts page.
Local trading systems to internalize costs of air pollution
Progressive taxation tools are becoming more common to encourage resource conservation and pollution prevention.
Some municipalities are charging citizens for disposing of garbage volumes produced above a certain limit like two bags per week. Water meters are used to encourage water conservation in a user-pay system.
There are precedents in the Canadian Environmental Protection Act allowing for companies to track volumes of exhaust pollutants so they can manage exhaust volumes over a period of time to attain clean air targets for their fleet of vehicles (Canada Gazette, 2003).
Air volume consumption information could be used as a basis for internalizing the cost of air pollution into our economic system. Should one's activities impact on more than an allocated volume of air, users could pay a pre-determined “polluting” fee, or trade, barter or buy volumes of available clean air from others whose activities and lifestyles do not consume as much air.
User fees that more clearly account for the air used in combustion could be incorporated into the price of liquid fuels. For example, a vehicle with a 3.5 L engine operating at 2,500 rpm, with a gas mileage of 10 L/100km and taking one hour to travel 100 km would convert (3.5 L × (2,500 rpm / 2) × 60 minutes) 262,500 litres of fresh air into exhaust. Dividing by 10, this translates into 26,250 litres of air converted into exhaust per litre of gasoline consumed.
The price of gasoline could also be made to vary in a manner that is inversely proportional to the forecast availability of fresh air, i.e. gas prices could increase (decrease) when the fresh air necessary for diluting exhaust decreases (increases). Ventilation information like that presented in figure 5 could be used to help price fuels in a manner that reflects the atmosphere's ability to effectively dilute the pollution.
The concept of clean air trading could also be applied internationally. Countries with large numbers of combustion engines could pay a “pollution fee” to countries with fewer engines as a way of recognizing the real costs of polluting the global air supply. This provides incentives for polluting countries to reduce their polluting sources and rewards developing countries for practising sustainable development not based on combustion engines. This market-economy approach could assist in reducing the exchange of transborder pollutants. Market mechanisms such as these are already being used to help reduce production of CO2 globally.
Conclusion
A ventilation-based accounting of the volumes of exhaust air passing through or consumed by urban engines is presented.
Volumes of fresh air converted into engine exhaust are provided using engine cylinder displacement (L) × rpm[/2] × minutes of operation. The method provides data that could be used for public awareness and economic tools to help internalize, into the marketplace, the cost of air pollution from combustion engines.
For combustion engines, a truck consumes the most air requiring 111 human-days per hour. Local school buses, SUVs and compact cars consumed 61, 40 and 29 humandays of air per hour respectively. Smaller engines like jet skis, lawn mowers, chainsaws and hedgers consumed 27, 1.5, 1.2, 0.6 human-days of air per hour respectively.
Using estimated numbers of engines on Montreal island, engines consume approximately 3.10×10¹² litres of air per day which represent about 175 times the volume of air required for breathing by the 1.8+ million people during a 24 hour period.
Under a stagnant ridge of high pressure, it is estimated that all engines would convert the clean air in the 1 km boundary layer into undiluted exhaust in about 160 days. If, however, each litre of exhaust is diluted with 1,000 additional litres of fresh air, the air in the boundary layer effectively becomes consumed in less than 1 day as a result.
Air consumption information allows for new types of airquality-related education tools. A web interface could help users calculate air consumption footprints. Tachometers in vehicles could remind drivers of how many human-days of air are being converted into exhaust while they drive. “What if” scenarios can help individuals and governments evaluate the impact on air consumption of proposed lifestyle changes.
Local clean air trading systems based on the concept of air volume consumption could allow those requiring larger volumes of air to pay for the air they need. Such user-pay systems could be established locally and globally.
Future work includes expanding the list of consumers of air, adding volumetric contributions from post-engine processes such as smog and roadway-generated particulates, determining proper exhaust dilution factors and packaging information so as to allow a variety of users to run their own air volume scenarios.
An easy-to-use and user-friendly mechanism that quantifies how we use the air in our daily lives could help internalize exhaust management into our economic system. Action on this front is necessary in order to prevent the “tragedy of the commons” as applied to the essential resource that is our shared atmosphere.
References
- Association canadienne des automobilistes, “Manuel complet de l'automobile”, Association canadienne des automobilistes et Selection du Reader`s Digest Ltee, 1983.
- Benson, Thomas J., NASA, email communication, March 2005.
- DeCicco John, Cook James, Bolze Dorene, Beyea Jan, “CO2 diet for a Greenhouse Planet: A citizen's guide for slowing global warming”, Audubon Policy Report, National Audubon Society, June 1990.
- Hardin, Garrett, “The Commons and Free Goods”, in Vital Views of the Environment, edited by Mary. E. Hawkins, National Science Teachers Association, 1201 16th street, N.W., Washington D.C., 20036, 1970.
- Isaac, George, “Nowcasting Airport Winter Weather”, Internal seminar, Canadian Meteorological Centre 2121 route transcanadienne, Dorval, April 29th, 2005.
- Lough Marvin, Robert Chatburn, W. Arlen Schrock, “Handbook of Respiratory Care”, Year Book Medical Publishers, 1983.
- Poulin, Lewis, “An educational tool to better estimate local air consumption patterns”, poster #675, presented at Canadian Meteorological and Oceanographic Society (CMOS) Congress, Vancouver, June 2005. See copy of poster at: chebucto.ca/Science/AIMET/lewis/air_model.
- Poulin, Marc, Various personal communications, University of Calgary, spring 2004.
- The Gazette, “Driving Section”, The Gazette publisher, 2004-2005.
- Canada Gazette, “Canadian Environmental Protection Act: On-Road Vehicle and Engine Emission Regulations”, Part II, Vol. 137, No. 1, Queen's Printer for Canada, 2003.
- Various other internet sites are available from the author.
Acknowledgements
The author, while not an expert in air quality chemistry, became interested in air volume consumption during his daily walks to and from work. A preliminary poster on air consumption volumes was presented at the Canadian Meteorological and Oceanographic Society (CMOS) Congress in Vancouver of June 2005. That poster data was further consolidated into this publication. Comments from various CMC colleagues, in particular Richard Hogue, and from the Editor of the CMOS Bulletin SCMO were very helpful at improving the publication. The author thanks his family for assisting in the development of these concepts.
The author is very grateful to Miguel Tremblay and Patrice Levesque for their dedication and hard work at translating the original publication from english to french and for developing the online air volume calculator now available for the general public at ptaff.ca.