On August 1st 2006, a violent thunderstorm struck the Montreal region.
Here is a movie created with the lightning observations made by the Canadian Lightning Detection Network. The background image is a map of the Montreal region, each circle showing where the lightning had struck.
A total of 1,696 lightnings were then observed in the Montreal region in a 90-minute period, from 20h30 to 22h00, local time.
1,696 lightnings, the movie
You can also download a free codec version (Ogg Theora and Ogg Vorbis) in the original format of this clip. You can use the VLC software to visualize this type of file.
Observations
The observations given by the lightning detection network contain the following informations:
- Date and time of lightning observation;
- Latitude and longitude where the lightning struck;
- Lightning current in kiloampere;
- Lightning type (from cloud to ground or from ground to cloud).
The lightning events represented on the map are located between the latitudes 45.32° and 45.74° N and between the longitudes 73.14° and 73.92° W. We used a lat-lon projection for the background image and to map where the lightning struck.
Number of lightnings
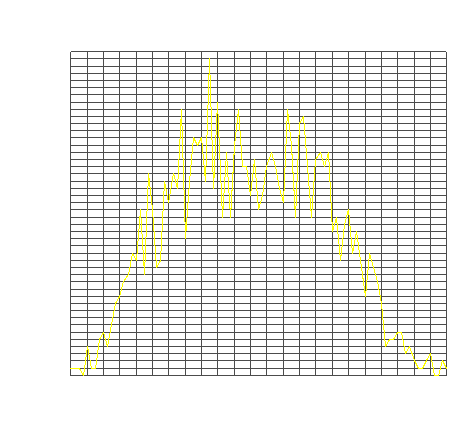
This graph shows the number of lightnings in function of time for the August 1st, 2006 thunderstorm. The little number of lightnings at the start and at the end of the period correspond to the apparition of the thunderstorm in the window of interest around Montreal. It is this window that we see in the movie 1,696 lightnings. The number of lightnings is at its peak in the middle of the period, corresponding to the maximum volume in the movie.

Current of lightning
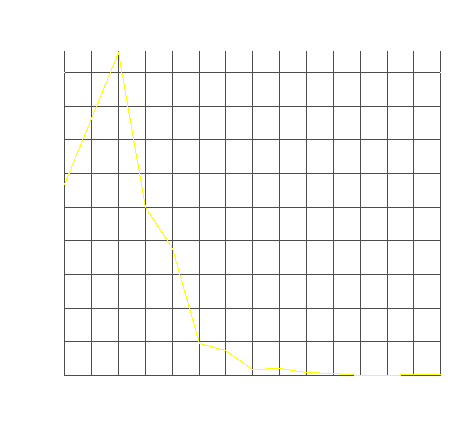
This graph (histogram) regroups the lightnings by the different current they had. The current is in kiloamperes.

Colors and duration of circles representing the lightning
2 series of colors are used to represent the lightnings: blue and red. The initial color and the duration of the circle representing the lightning are function of the current: the highest the current is in kA, the more vivid will the color be and the longer will the circle be shown.
Each circle is shown for a minimum of a 1/3 second (8 images) up to a maximum of 4/3 second (32 images).
Palette used for cloud-ground lightning
Color palette for the ground-cloud lightning
Sound
The sound that we hear each time lightning happens is a synthetic bass drum. The sound can be familiar to those using MIDI files but it is in fact a sound created with the CSound software. The lightnings that goes from cloud to ground have a more "traditional" sound; those going from ground to cloud have a more synthetic one.
Radar images
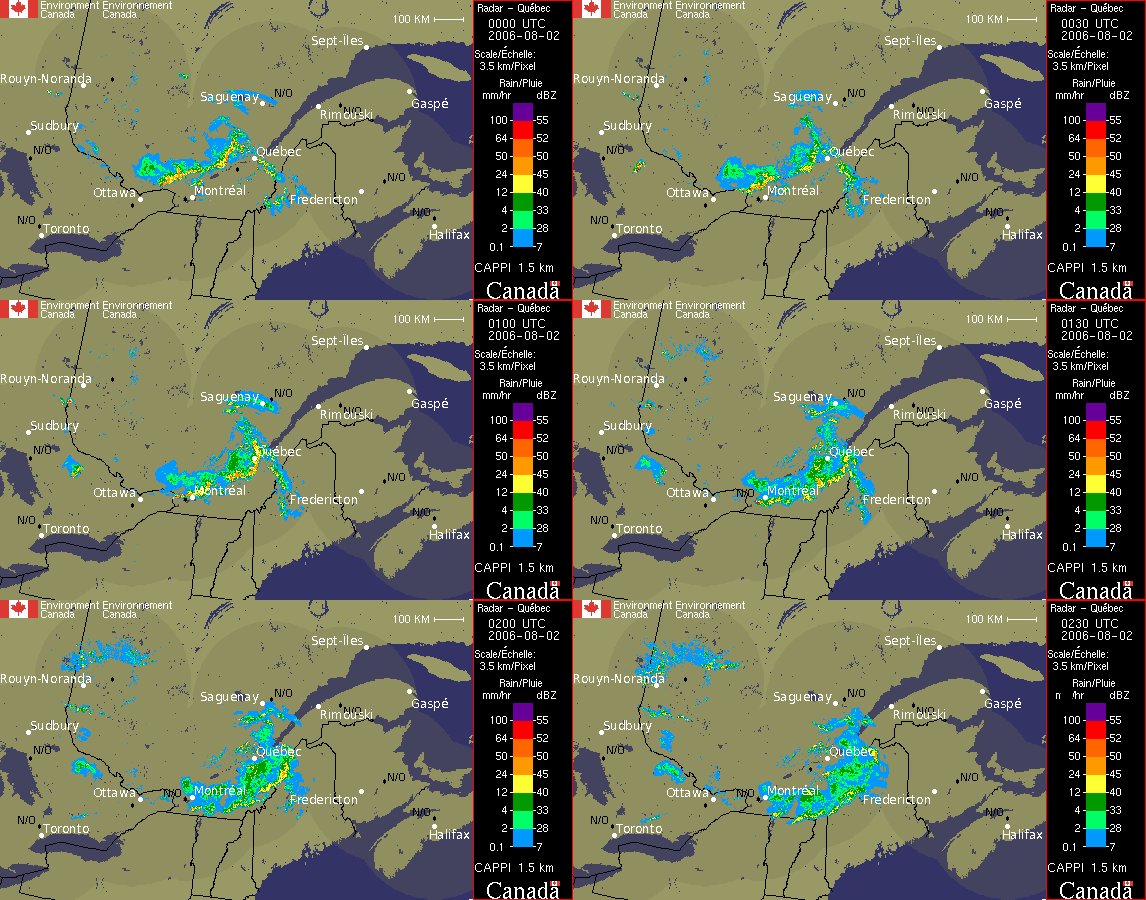
The meteorological radars of Quebec saw this thunderstorm very well. Here are the radar images created from Environment Canada's data, for the period of August 1st from 14h to 23h Eastern Daylight Time (EDT).
Note: The date on the images corresponds to the UTC time, noted Z, and are 4 hours later than the local hour, i.e. from August 1st 18Z to August 2nd 3Z.
The thunderstorm visited the Montreal region, as written in the lower right corner of the movie 1,696 lightnings, between 20h and 21h local time, i.e. between 00Z and 01Z on August 2nd.

GEM-LAM model numerical weather prediction analysis
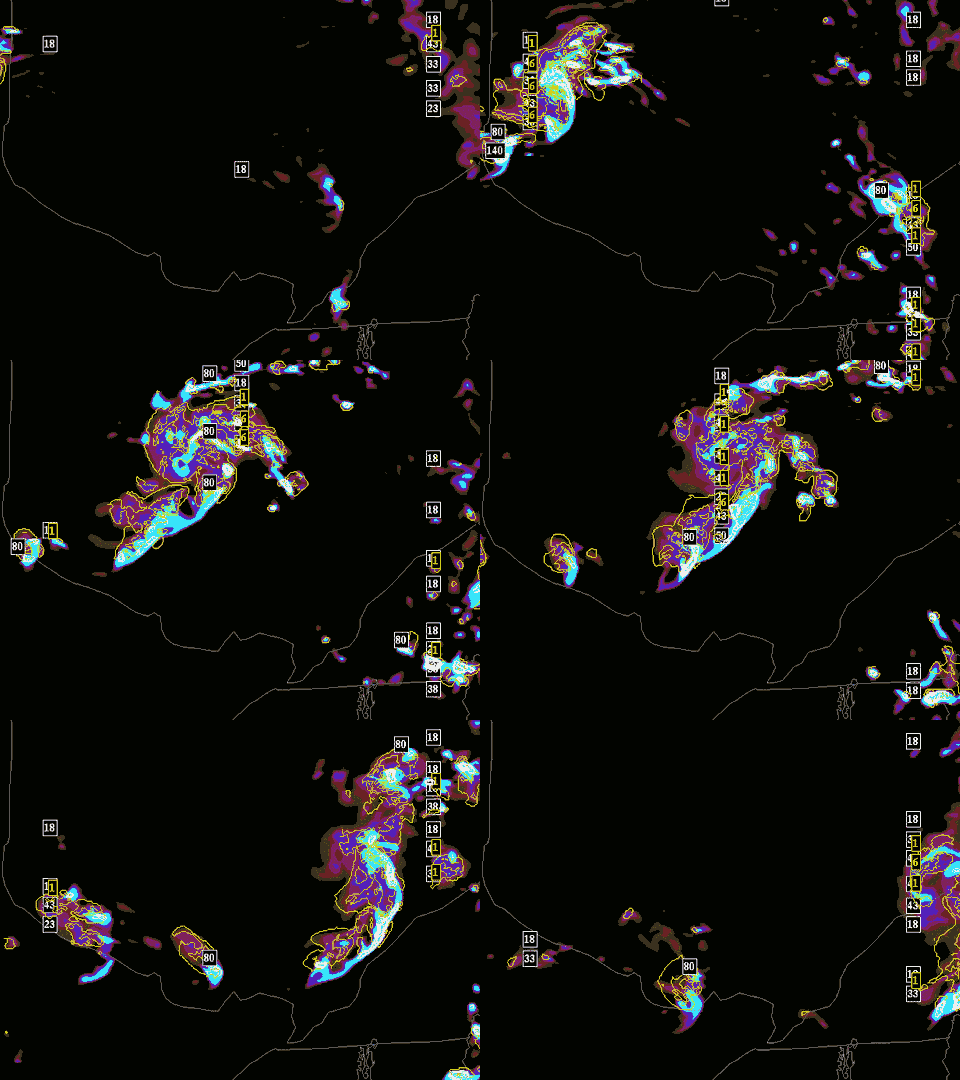
The meteorological weather models perform what we call an analysis: the observations of the meteorological measure instruments (meteorological stations, satellites, etc.) are used in order to create an estimation of what the meteorological conditions were in a moment in the past.
The images below comes from the Limited Area Model from Environment Canada (named GEM-LAM) for East Canada. The numbers on the images show the precipitation rate in mm per hour.

Technical details
Free software used
Only free software was used to create this movie. It was done on a GNU/Linux box. Here is a list of the software used:
- Python (cement):
- ImageMagick (credits images and time on the images);
- CSound (sound of lightning);
- Audacity (sound montage);
- transcode (movie generation);
- MEncoder (video assemblage and formatting).
Code and observations data
The code written to create this movie is distributed under the GPL licence and can be used with the observations of the Canadian Lightning Detection Network to create a movie like this one.
A background image can be chosen arbitrarily. It is possible to choose another region in North America and another time period and create a movie that will allow to visualize the lightning flashes for this period.
The data format to create a movie is a simple text file (ASCII) with the lightning observations. There are 5 columns:
- Column 1
- Date, in the YYYY-MM-DD format
- Column 2
- Time, in GMT, given to nanosecond resolution
- Column 3
- Latitude, in signed decimal degrees
- Column 4
- Longitude, in signed decimal degrees
- Column 5
- Event strength, in kiloamperes
If you ever try to create a movie with this code and you have difficulties, you are welcomed to contact the author to ask for help. It will be a pleasure to answer.